| Return to homepage | Day 1, Part 2 > |
Day 1, Part 1
Welcome to Day 1 of the session! Today, we’ll be covering:
- What is data? What is data visualization?
- Why visualize?
- Types of data
- Chart types
- Gestalt principles
- Sketching/planning a visualization/data storytelling
What is data?
To get started, we’ll begin at the foundation: defining data. There are endless ways to phrase what data are, but a simple way of thinking about it is that data are pieces of information that, when combined and analyzed, describe that information.
Some examples of data might include:
- Recorded temperature over time
- Number and titles of books in a library
- Number of pens you lose in a year
- Interviews with UW students in a research study
- Latitude and longitude of your favorite restaurants in Washington
- Census records
- Answers to a user survey
Data can be composed of digital and analog records, can be quantitative, qualitative, or geospatial, and so on. It might exist in spreadsheet software or on the back of a napkin. You likely come across data everyday, even if it’s not always remarkable!
What is data visualization?
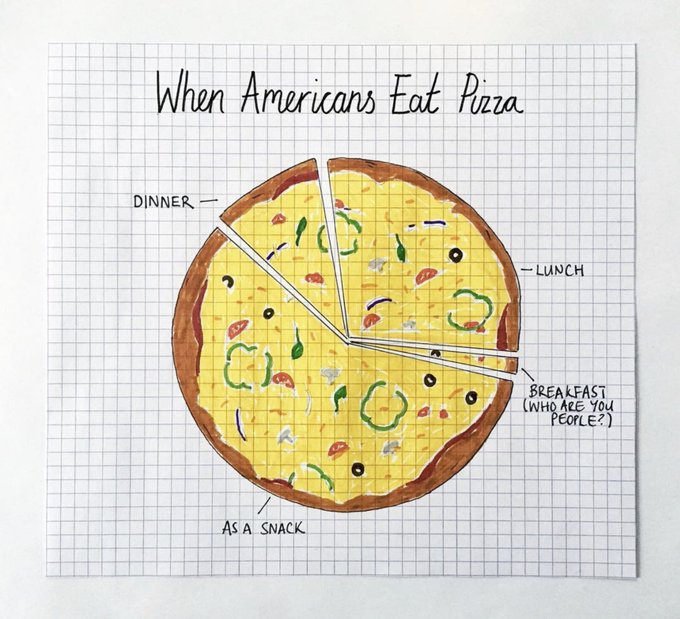
Data visualization takes data and presents it in a graphical form. Data visualizations can be created by specific software, digital technologies, or even by hand. Below are some examples of data visualizations.
For a glossary of data visualization-related terms, please refer to the data visualization guide.
Mona Chalabi, “When Americans eat pizza”
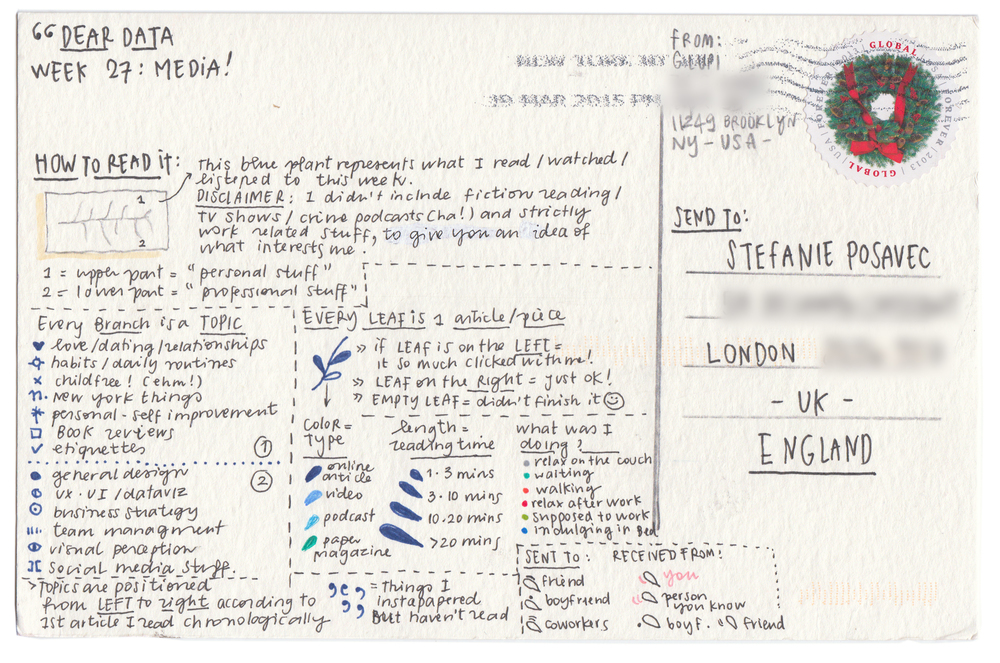
Dear Data, “A week of media,” Giorgia Lupi

Stephanie Evergreen, Percent of people in poverty 2009-2017

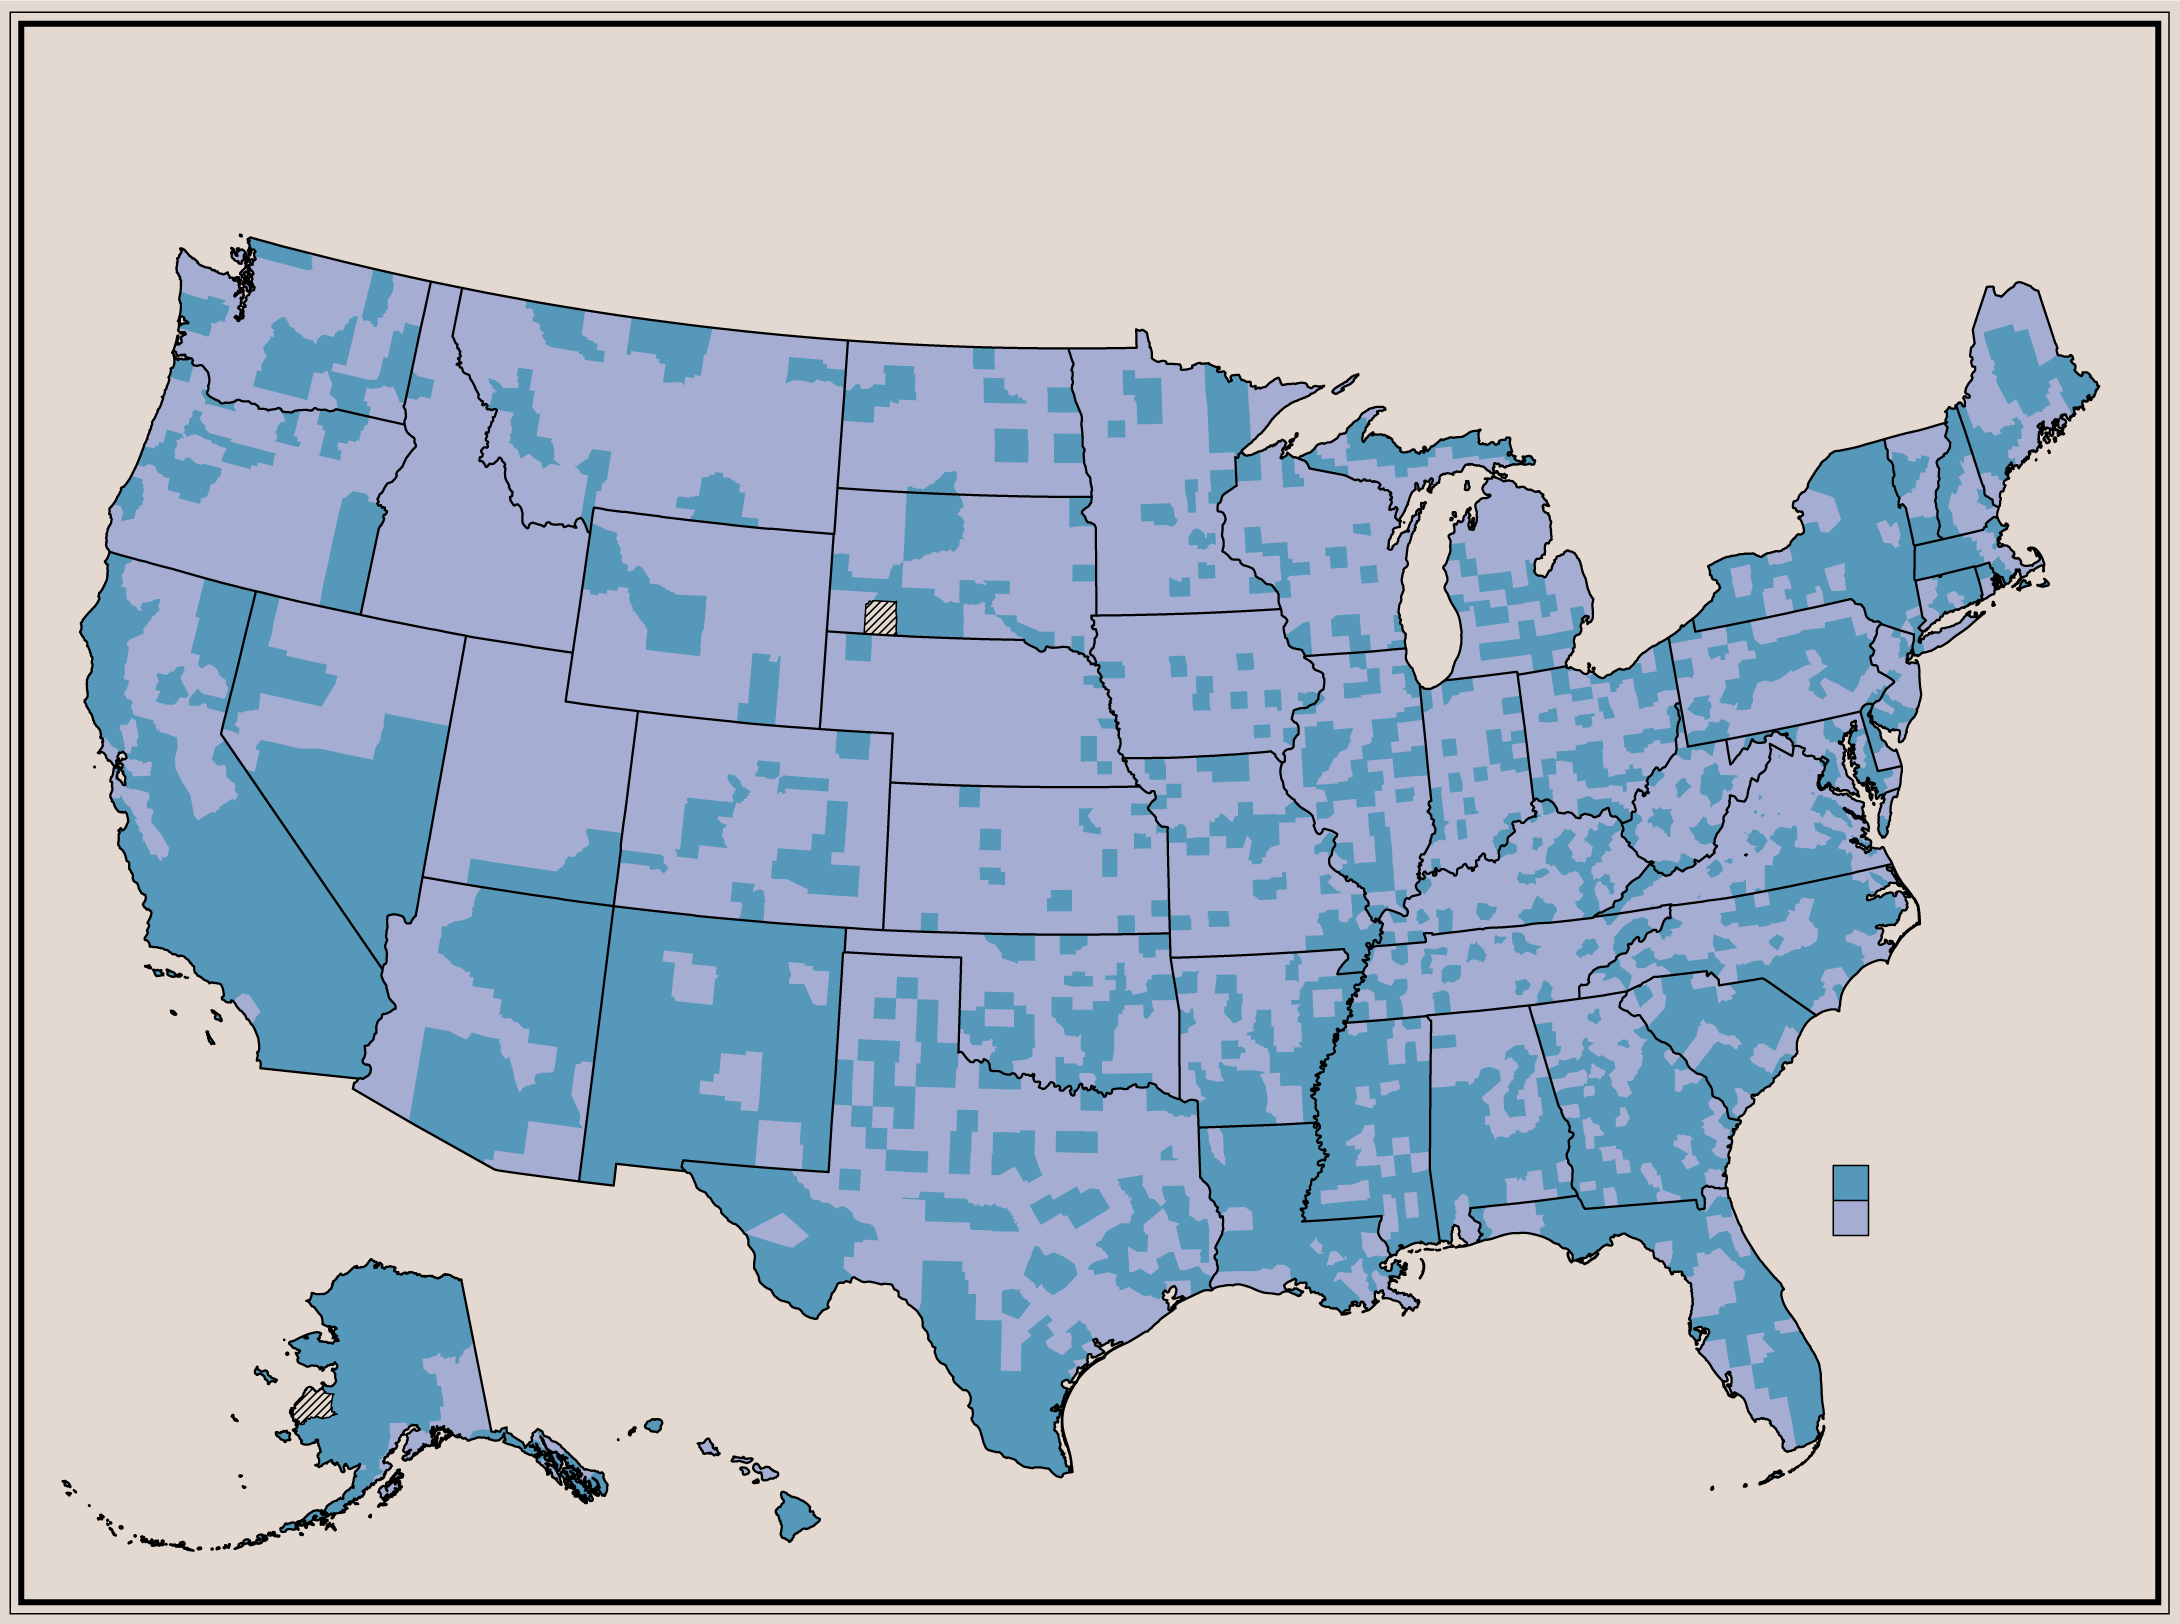
Nathan Yau, “Where People Are Married and Not”
Why visualize?
There are many reasons to visualize data. An incomplete list is below:
- Communicate information in an engaging format
- Make it easier to absorb large quantities of data
- Identify trends and outliers in data
Sometimes, the reasons are less lofty: it’s because our boss asked us to make one or because we need an image for a journal article. Whatever the reason, there are some general principles that will guide any visualization, which will be covered this week.
Types of data
There are two primary types of data: quantitative and qualitative. You will likely come across both types at some point. You may also come across geospatial data, potentially embedded in other types of datasets.
Quantitative data is typically numerical and can be counted or compared. Put simply, if you can do math with the data points, it is likely quantitative. Some examples of quantitative data include:
- Temperature in Seattle over the past ten years
- Number of books checked out of the library over an academic year
- Class average on a midterm
Qualitative data, on the other hand, is descriptive and is often in a narrative form. It tends to be comprised of text. Some examples of qualitative data include:
- Interviews of health sciences professors at the UW
- Observations of otter behavior at the Seattle Aquarium
- Questionnaire about students’ remote learning experiences
Geospatial data is different than quantitative and qualitative – it is comprised of specific points on Earth. Some examples of geospatial data include:
- Coordinates of your favorite restaurants in your hometown
- Coordinates of your route to school or work
The tool we will use this week is best suited for quantitative and geospatial data.
Chart types
There are several chart types that effectively communicate data. Some of the most frequently used chart types are described below.
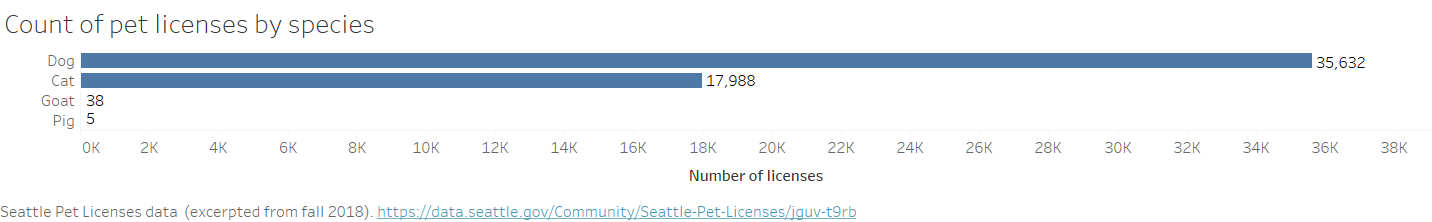
Bar charts
Bar charts are some of the most commonly used charts. They are great for comparing categorical data (for example, colors, book titles, departments, etc.).
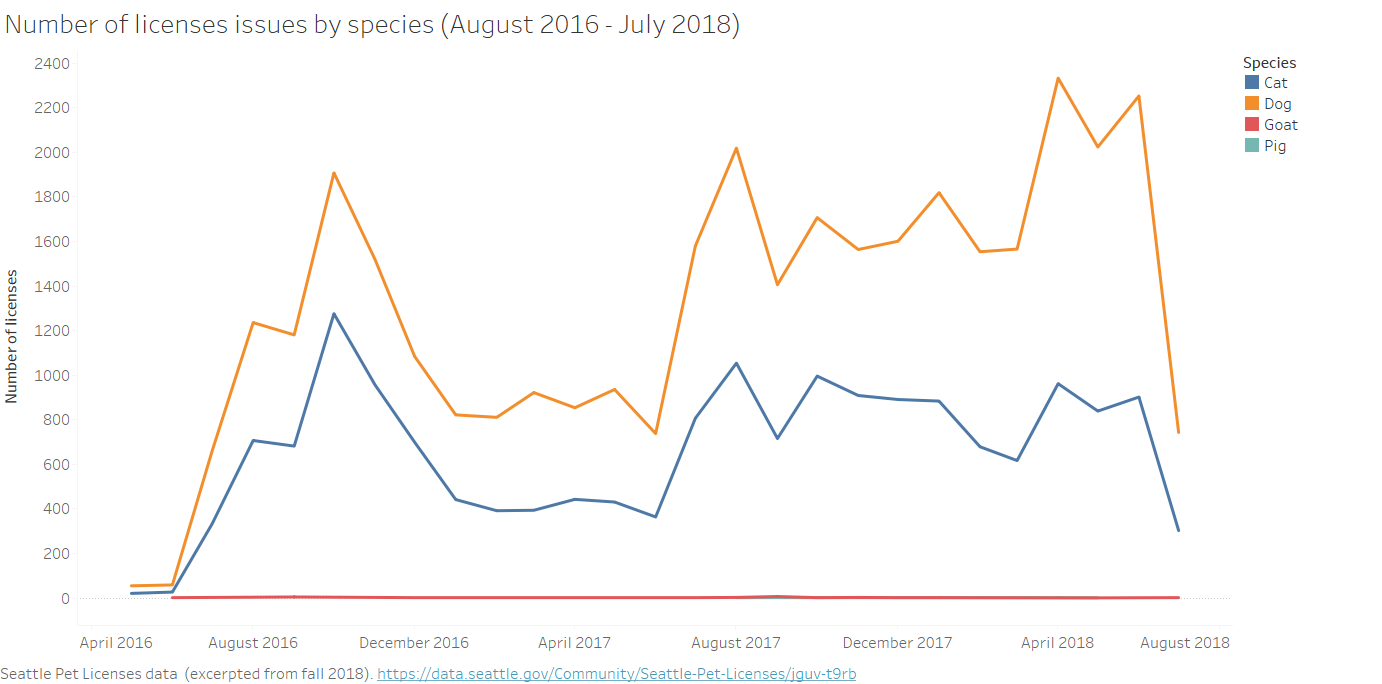
Line charts
Line charts are great at showing change over time. They are continuous and useful for comparing values over a period of time.
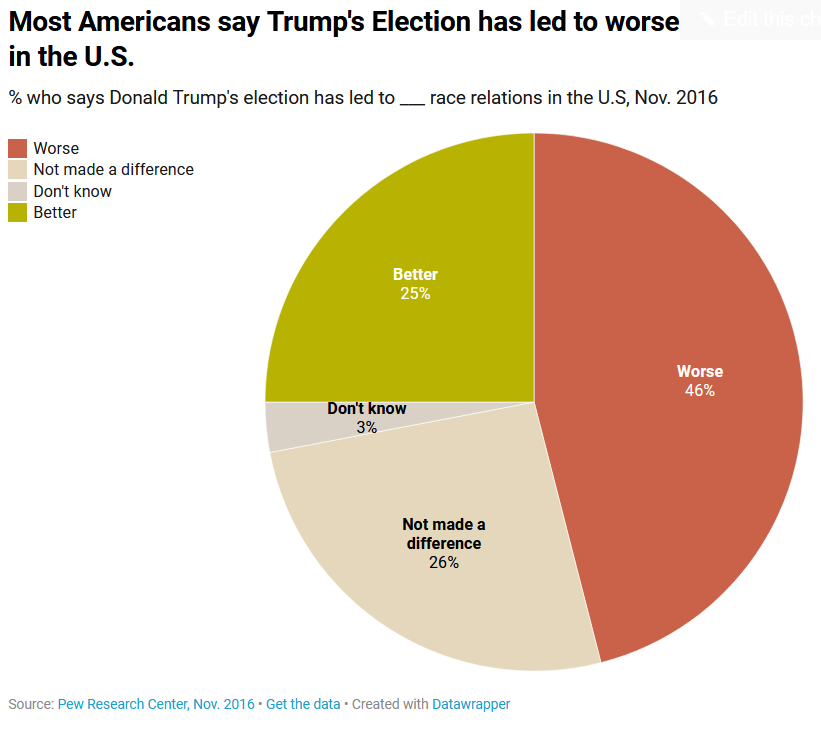
Pie charts
The utility of pie charts is heavily debated in the data visualization world. Pie charts can be useful if they only present a few data points, are not cluttered but have labels, are 2-dimensional, they add up to 100%, and they are not from multiple points of time. They can quickly show parts of a whole.
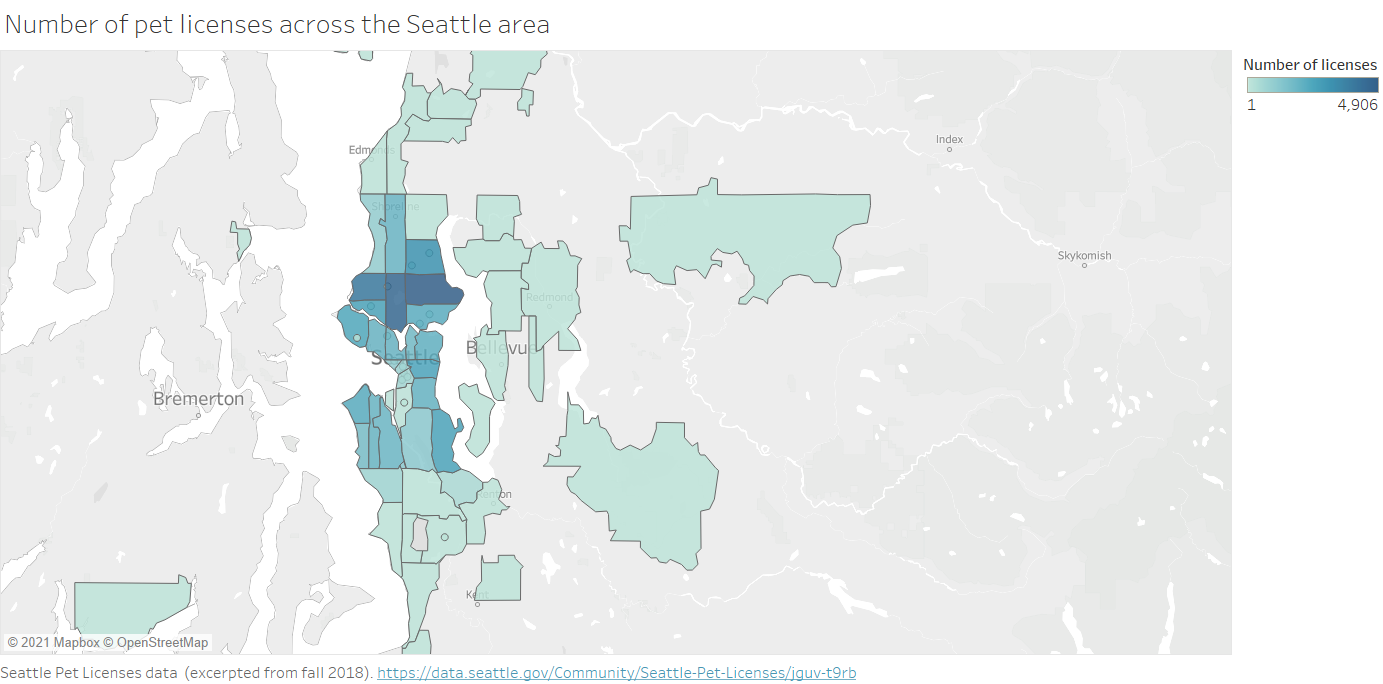
Maps
Maps are an intiutive and useful way to represent spatial data. They can identify the locations of places in relation to each other and can have data points attached to them.
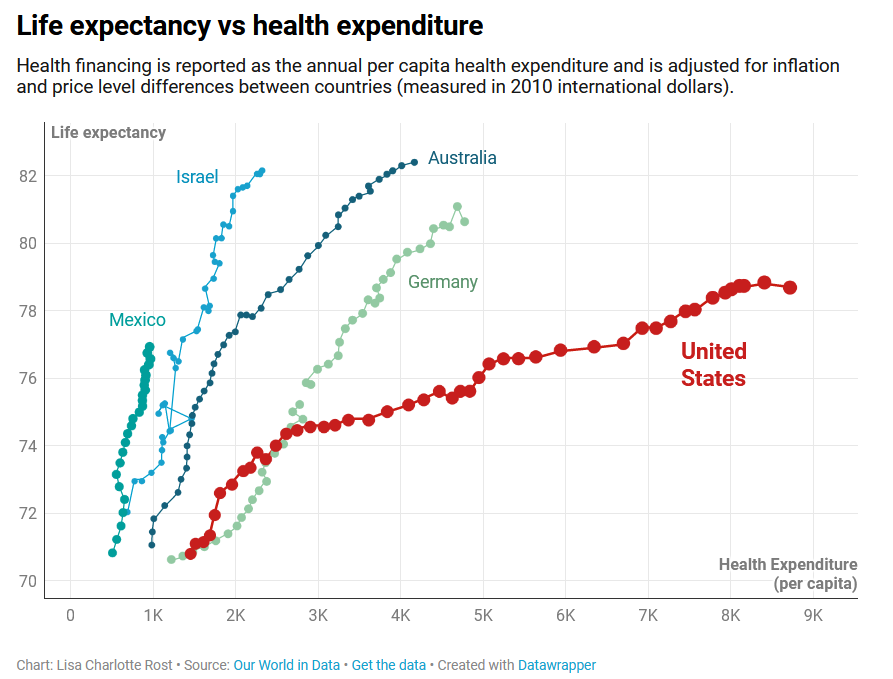
Scatter plots
Scatter plots help identify the relationship (if any) between two variables.
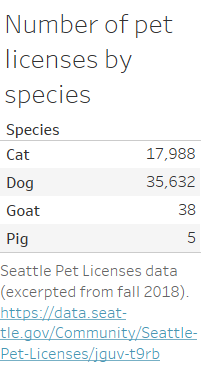
Tables
Yes, tables can also be visualizations! Tables are a simple and effective way to compare variables against one another. Much like pie charts, they are most useful when they are not cluttered and include descriptive labels.
For further descriptions and examples of chart types, check out Chartio, Mike Yi and Mary Sapountzis, “Essential Chart Types for Data Visualization,” September 30 2019.
Another useful tool for selecting an appropriate chart type for your data is The Data Visualization Catalogue. Not only does this site provide detailed descriptions of each chart type, it also has a function to search by function/relationships.
Part 2
Whenever you’re ready, proceed to Day 1, Part 2 or return to the homepage.