| < Day 2, Part 1 | Return to homepage | Day 3, Part 1 > |
Day 2, Part 2
Welcome to Part 2! This part will give an overview of the data visualization assignment for this week as well as go over the tool that we’ll be using to create visualizations. Before starting your visualization, check out the tips from Day 1, Part 2 on planning and sketching before creating a visualization. For more detailed instructions, refer to the resources at the end of this page.
Goal of this project
The goal of this week is to create a visualization on a topic of your choosing using Datawrapper, a data visualization tool.
To create this visualization, find a dataset that interests you, clean and prepare it for visualization, then create a visualization by Day 5. If you are short on time, feel free to use the sample datasets provided by Datawrapper.
Datawrapper
The visualization tool for this week is Datawrapper. It is a non-commercial, open source software that does not require you to install anything on your device (it runs using most browsers). While Datawrapper does not have the same capabilities to create highly complex visualizations (such as Excel or Tableau), it allows for some customization and has a gentler learning curve than other tools.
Creating an account
Although you do not need to create a Datawrapper account, you will not be able to edit any visualizations in the future unless you have an account. You can follow the steps to create an account if you would like to save your visualizations.
Getting started
From the Datawrapper homepage, click on Start creating to begin.
Upload data
The first step is to upload your dataset. Datawrapper provides a few options: copying & pasting a table, uploading a CSV or Excel file, importing a Google Sheets spreadsheet, or linking to an external dataset that lives on a different website. The method of uploading your dataset depends on where your dataset lives. You may find it easiest to have your data in a spreadsheet (in Excel or Google Sheets) in order to upload to Datawrapper.
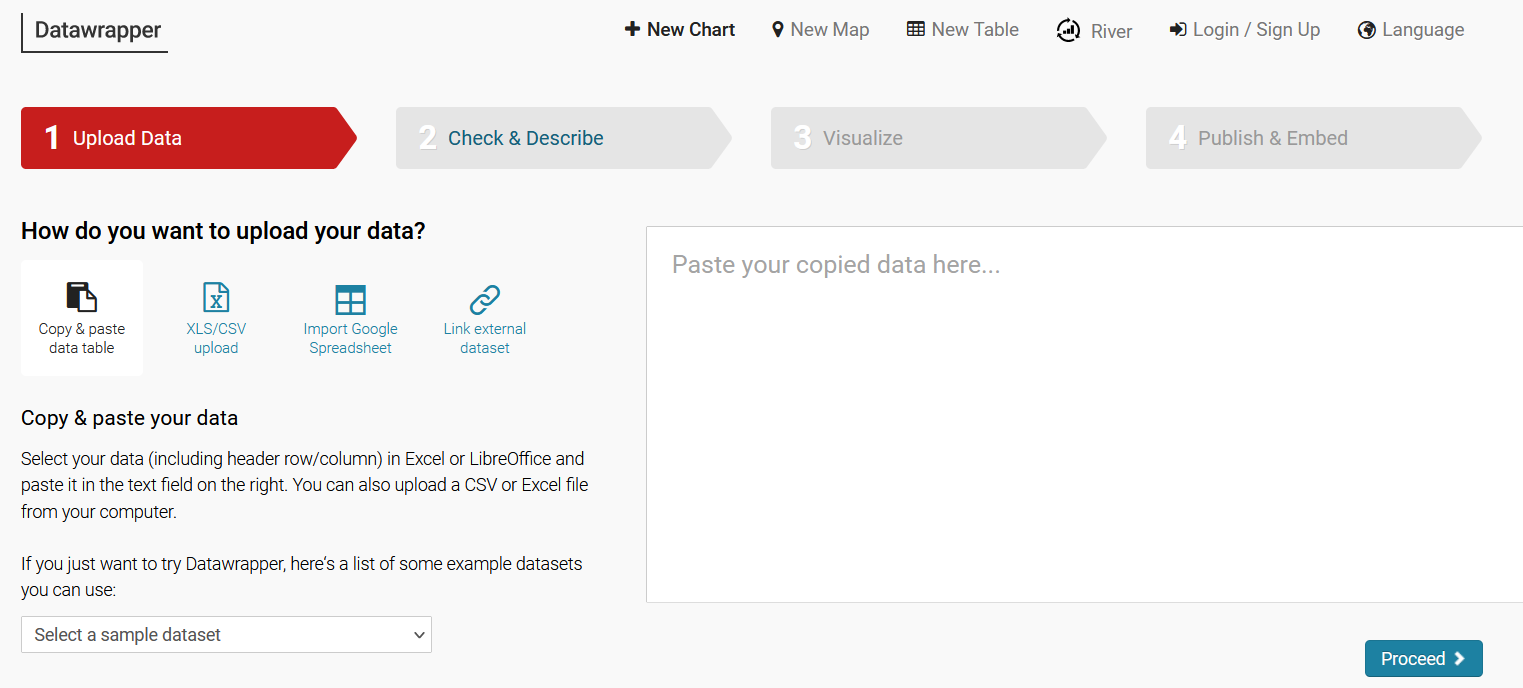
This walkthrough will use a sample dataset from the sample collection provided by Datawrapper. Note that any data you upload will be on Datawrapper’s server, so do not upload any confidential or sensitive data.
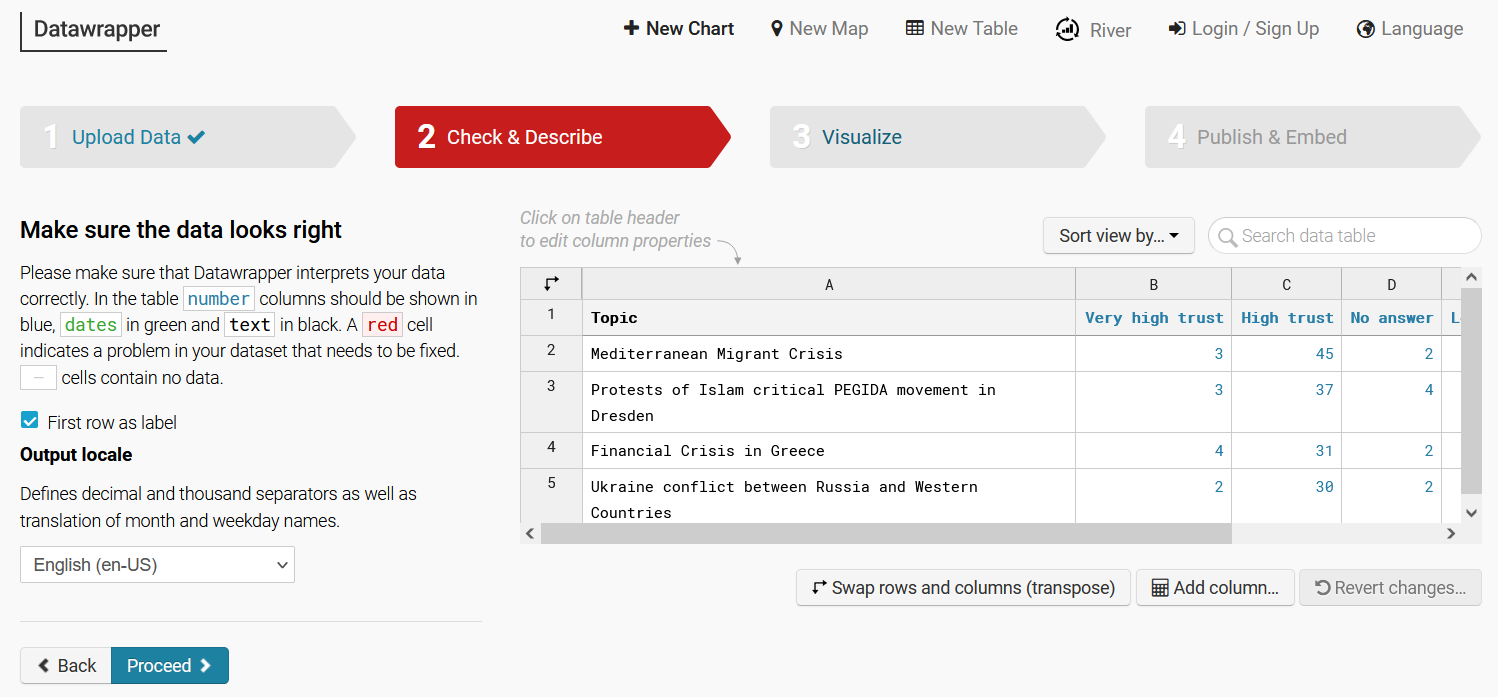
Check & Describe
This step allows you to review your data and make any necessary changes. Some things to keep in mind:
- If your first row includes column headers, be sure to check the First row as label box.
- Click on a column to check and change column properties (for example, changing a variable from text to number).
- If you need to create a new field that calculates certain variables in your data, click on Add column.
Visualize
Under the Chart type tab, select a chart that works best with your data and the story you are trying to tell.
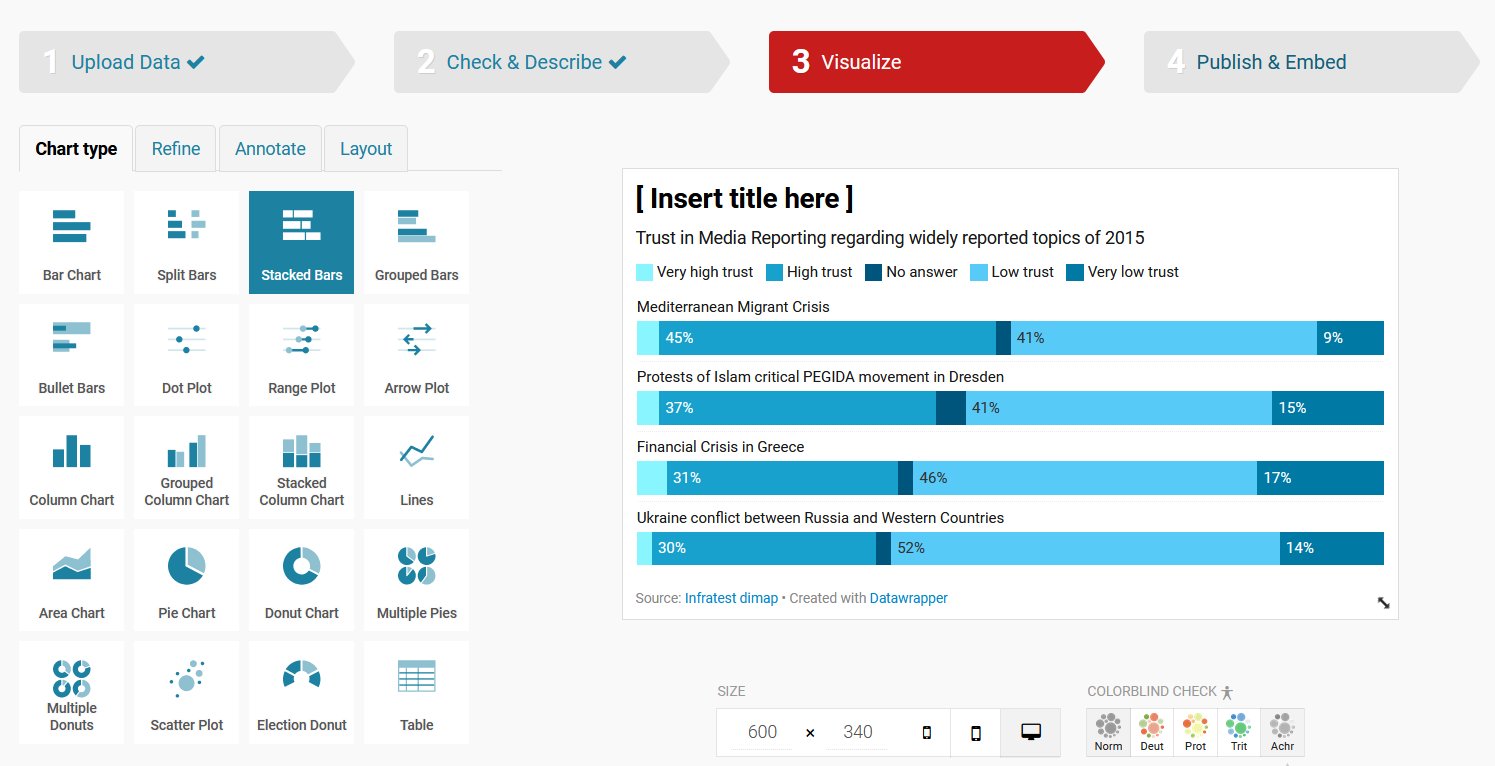
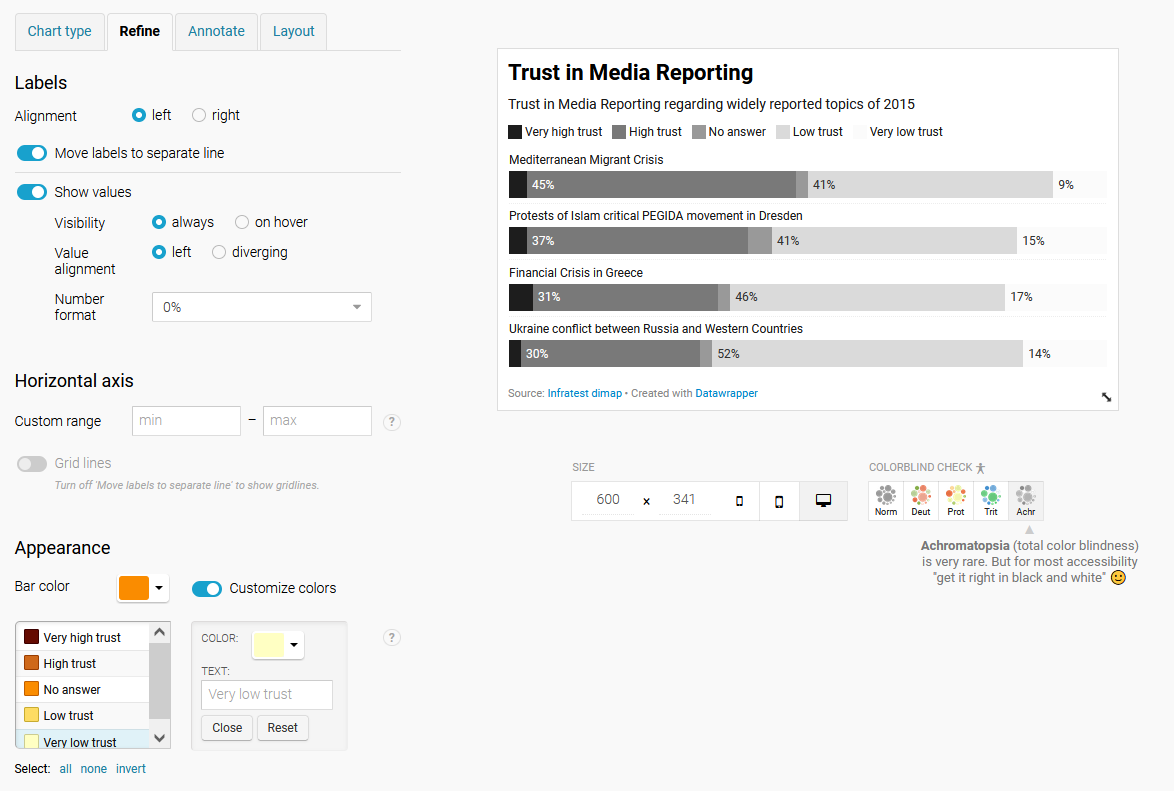
The Refine tab allows you to adjust the features of the visualization, such as the color.
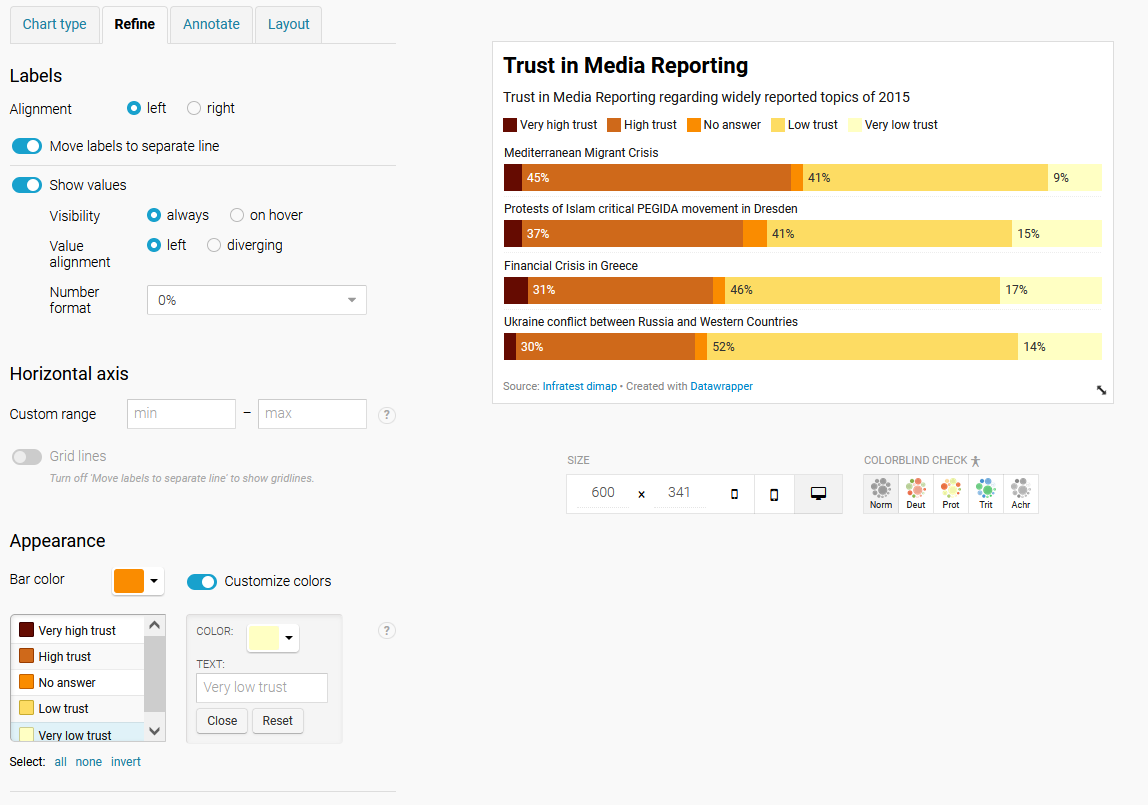
Note that this tab has options to check your visualization against colorblind lenses.
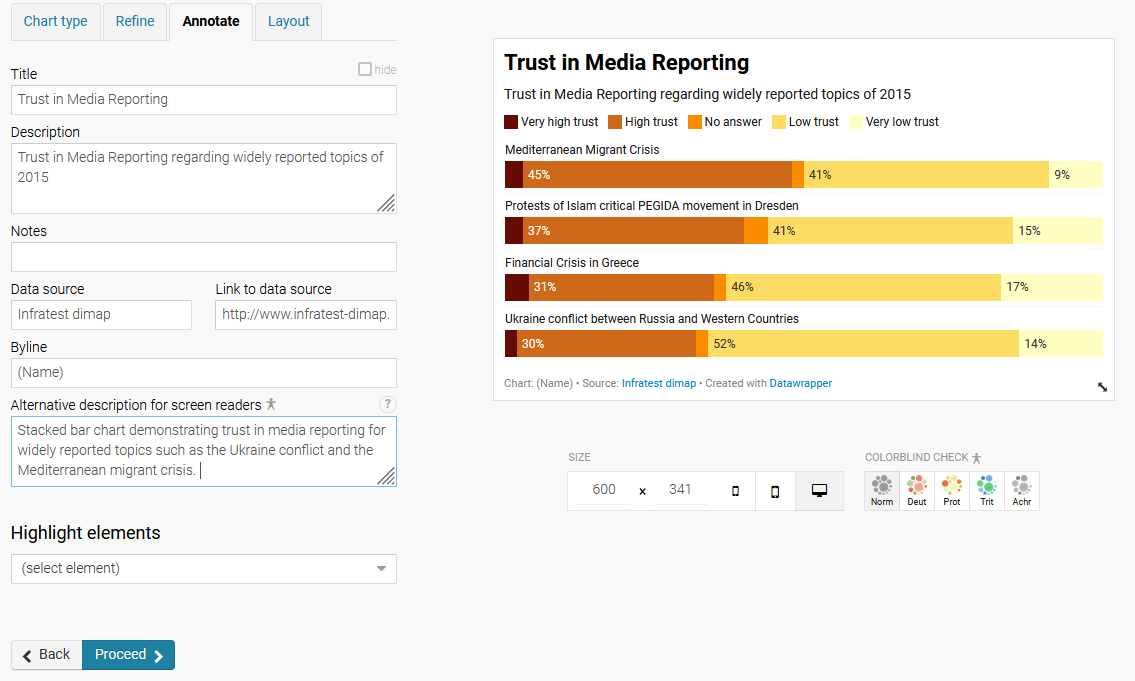
The Annotate tab allows you to add metadata, such as the name of the creator and source of the data, as well as alternative text.
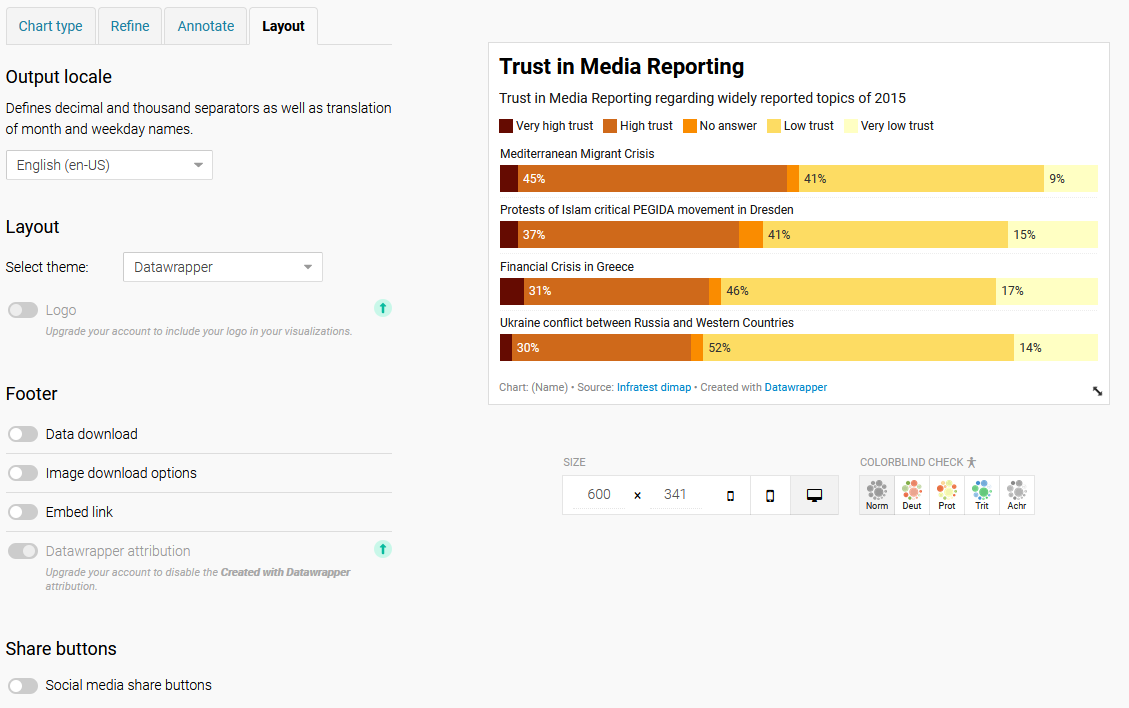
The Layout tab lets you adjust the layout and theme of the visualization.
Day 5 will include further instructions on how to share your visualization with the rest of the members of this cohort.
For more detailed, step by step instructions on creating a visualization, refer to the following resources:
Whenever you’re ready, proceed to Day 3, Part 1 or return to the homepage.