< Day 2, Part 2 | Return to homepage | Day 3, Part 2 >
Day 3, Part 1
Welcome to Day 3! Today’s focus is going to be on data visualization and inclusion. A visualization is not useful if it is not accessible by readers and can be harmful when it is not inclusive and reinforces biases.
To begin to frame this topic, the following quote by Giorgia Lupi (co-creator of the Dear Data series that was excerpted in Day 1) helps lay out the ways in which data are more than just pieces of information:
“Data represents real life. It is a snapshot of the world, in the same way that a picture catches a small moment in time. Numbers are always placeholders for something else, a way to capture a point of view — but sometimes this can get lost. Failing to represent these limitations and nuances and blindly putting numbers in a chart is like reviewing a movie by analyzing the chemical properties of the cellulose on which the images were recorded.”
- Giorgia Lupi, “Data Humanism, the Revolution will be Visualized”
Data represent real people, places, and things – it is a proxy for real life.
However, when we work with data, we often abstract it further and further away from real life. Language such as:
- wrangle
- clean
- prepare
- normalize
- tidy
indicates the methods that are used that, in the effort to make data easier to process, creates a bigger gap between the data points and the people behind them.
Let’s look at an example:
- Person A fills out a Census survey and their response in the race section is that they are white.
- However, if you had asked the person to fill out a short answer question about their race, they would have identified as Iranian, ethnically Persian. This is a very different answer than the single choice option provided in the Census.
When we look at how the United States defines race, we see that “white” actually comprises of large groups of people who likely have different lived experiences, bodies, and histories.
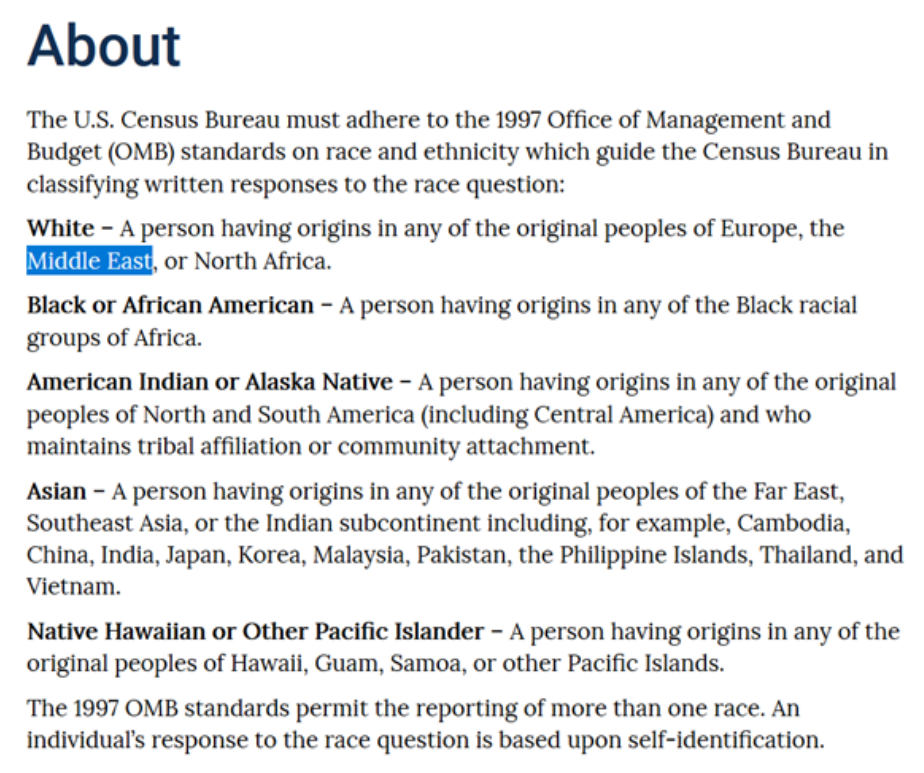
According to the US government, there are a few specific racial categories, a category for 2 or more races (though it often does not matter which 2 or more races), and an “other” category. Given the complexity of how to define race, it is difficult to see how only a few categories of race are sufficient to capture the full identities of people. This oversimplification of racial data makes it very easy for computers to process and for analyzers to make comparisons and for those in power to make decisions based on the supposedly objective data (where there are no other answers and everything fits cleanly into these categories). However, what this does is fail to recognize the full depth of individual histories and identities.
Let’s say that we decide that we’ll just expand our categories – a good example of this is Statistics Canada, which has many more categories.
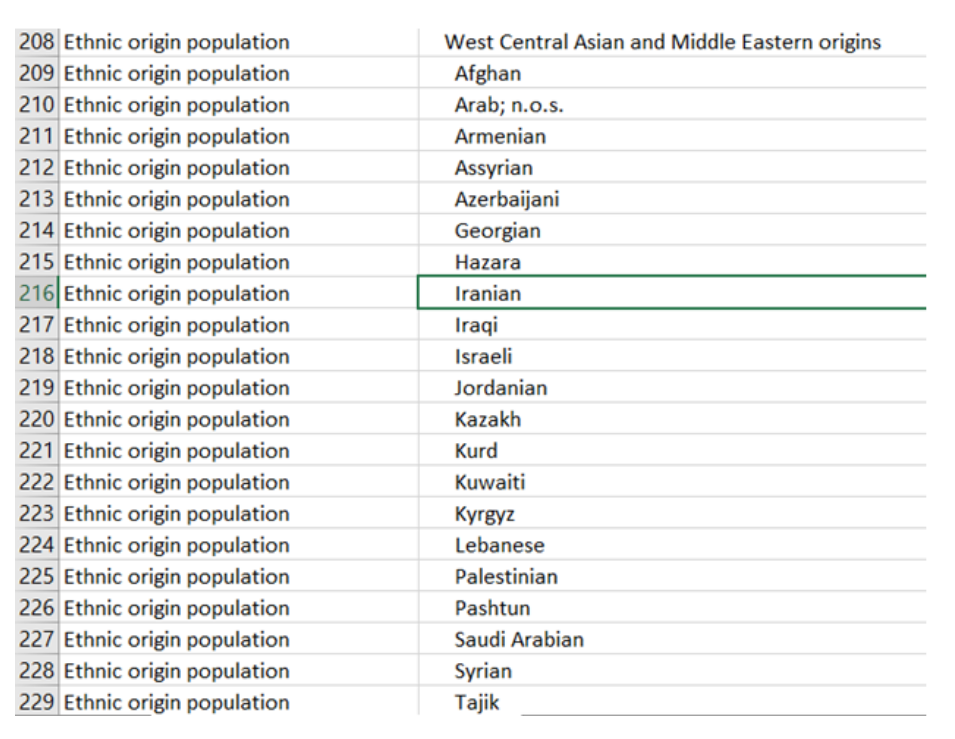
It’s more in depth, but still, this approach strips away some pieces of that person’s identity so that they are easier for a computer to process.
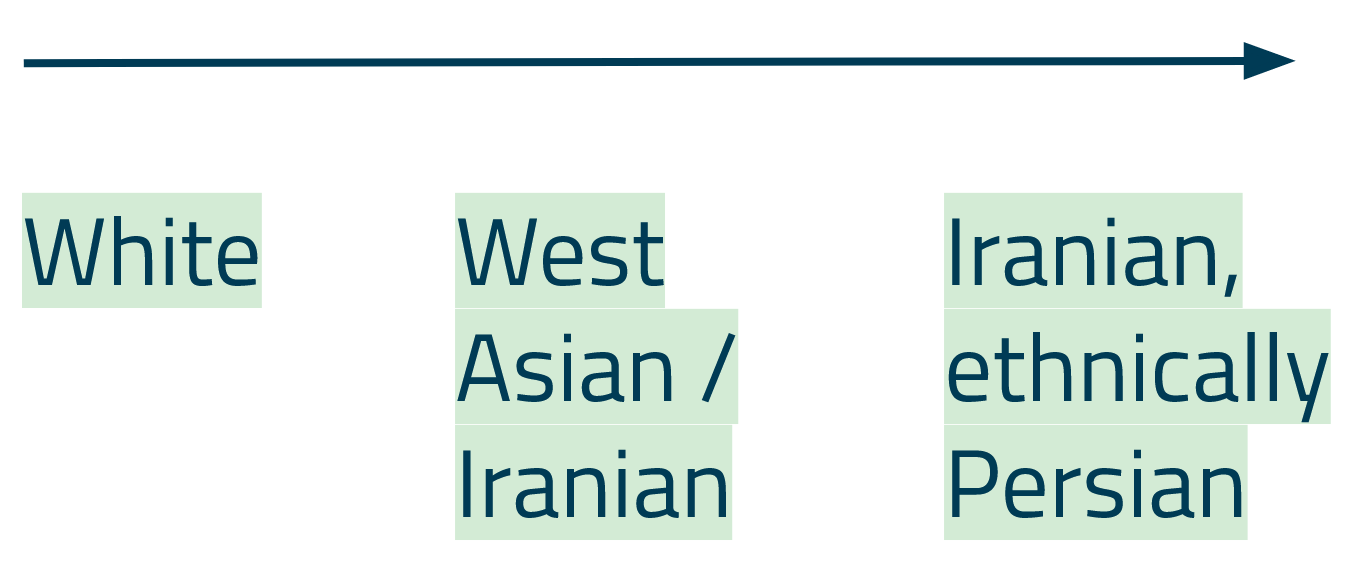
When comparing these three different ways of identifying, it’s clear that the ability for these data structures to capture an identity fully sit far from each other. If this data were to be used to, for example, determine where to bring in funding or support, some people and communities could fall through the cracks.
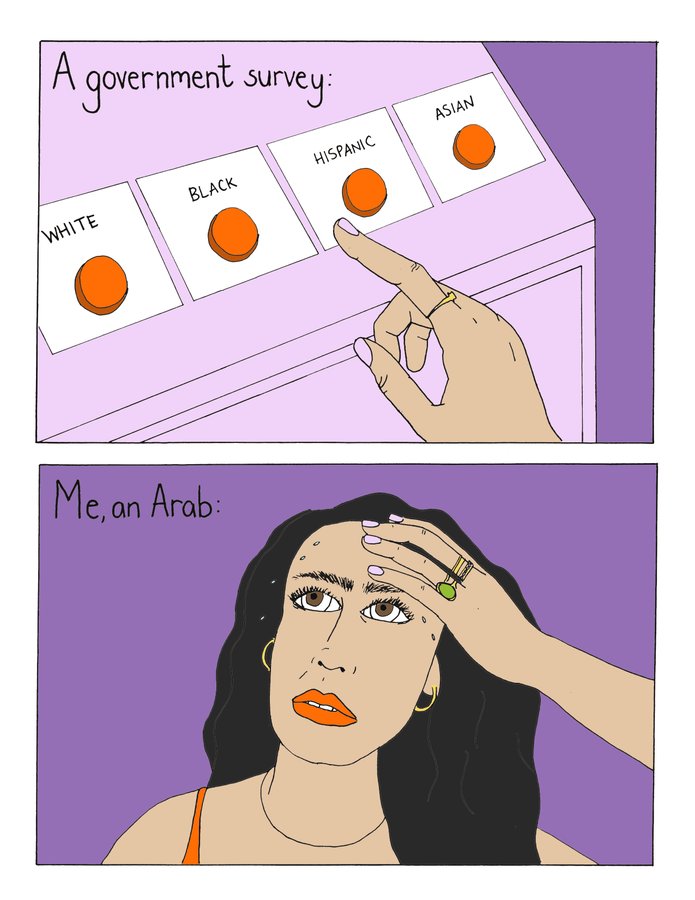
Perhaps more importantly, it can be harmful to someone who does not fit within these predetermined structures to not feel seen or recognized. This approach to gathering data can exclude people by oversimplifying identities.
Mona Chalabi, a data editor and artist, sketches this situation in “Choices”:
Another way that harm is inflicted on minoritized groups is through the “othering” of them in data. The following example uses a subset of demographic data from Washington Counties, as made available by the Washington Office of Financial Management 2010 Census detailed demographic profile.
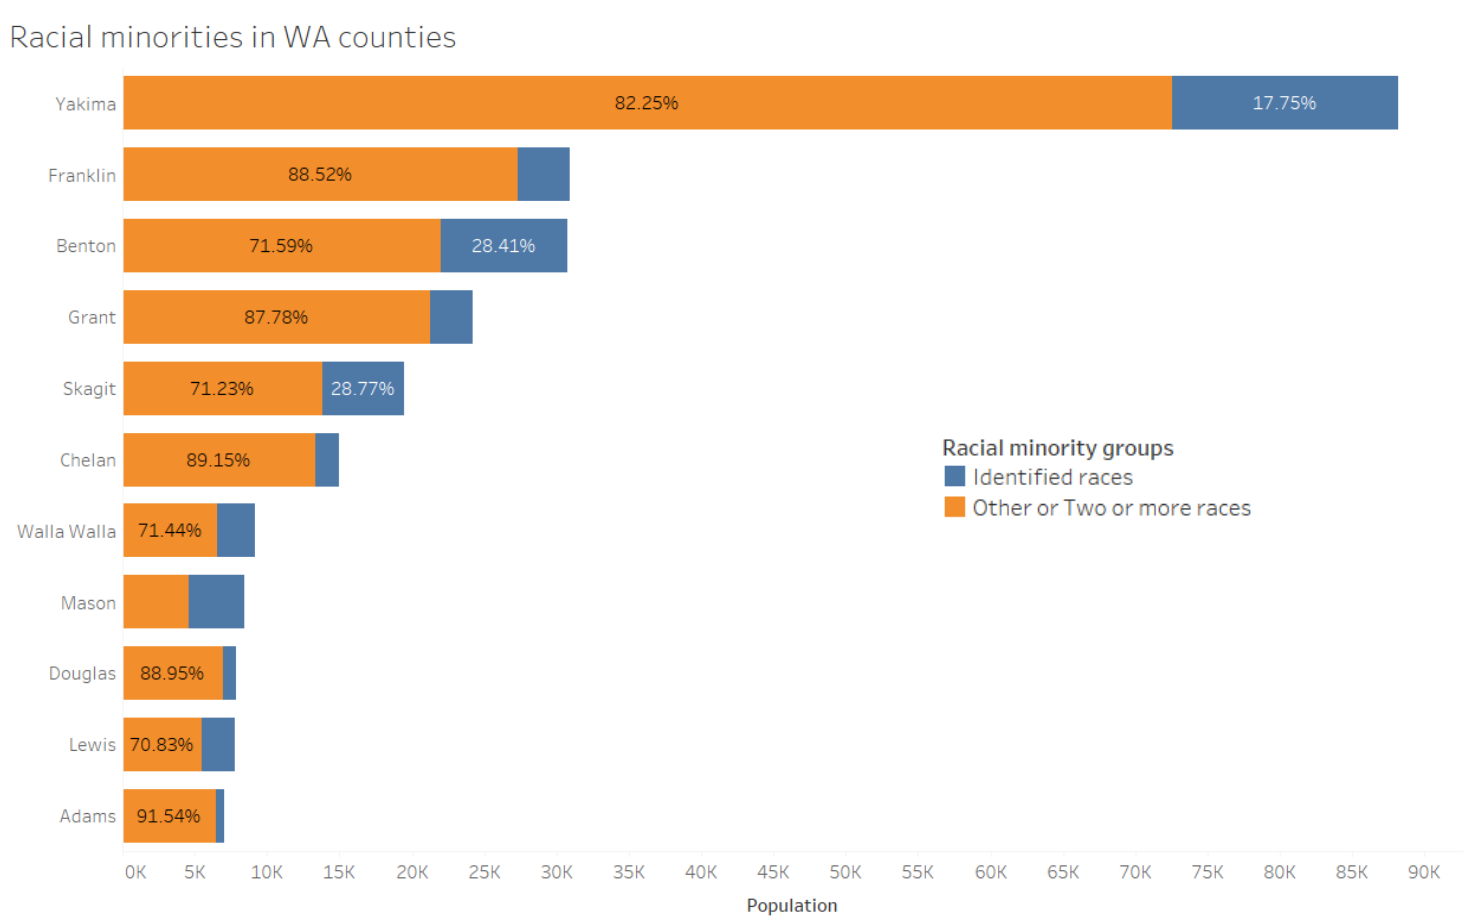
This chart looks at what have been categorized as “identified races” that are still oversimplified, but are not “other” – Black or African American, American Indian or Alaska Native, Asian, Native Hawaiian or Other Pacific Islander – and “other or two or more races” – categories that have no information about the people who responded except that they did not fit into the few choices that the survey provided. This contributes to othering and erasing those identities for the purpose of making it easier for a computer or program to analyze. To be transparent, this chart includes only racial minorities and highlights counties where this issue is the most prevalent. Still, some populous counties, such as Yakima and Franklin, have a large proportion of people of color who have been othered in the data.
Abigail Echo-Hawk from the Urban Indian Health Institute mentions in an interview the ways in which data is harmful to Indigenous communities:
“One of the ways that there is a continuing genocide against American Indians/Alaska Natives is through data. When we are invisible in the data, we no longer exist. When I see an asterisk that says “not statistically significant,” or they lump us together with Pacific Islanders and Asian Americans – you can’t lump racial groups together. That is bad data practice.”
This is just one example of how decisions we make about how our data are structured can make people and communities invisible in our data.
This practice shows up in gender and data as well. There are either two (“male/female”) or three (“male/female/other”) categories. The “other” category exists as an attempt to capture gender identities existing outside of the binary structures that attempt to dominate systems – though it does, both literally and in practice, “other” nonbinary identities. The data structures that exist were not developed to capture anything beyond the binary, as described in the following publication by the MIT Center for Civic Media, “A Primer on Non-Binary Gender and Big Data”:
“…non-binary gender and data represents complicated terrain for computational applications for numerous reasons. But we have an ethical and empirical imperative to tackle this complexity.”
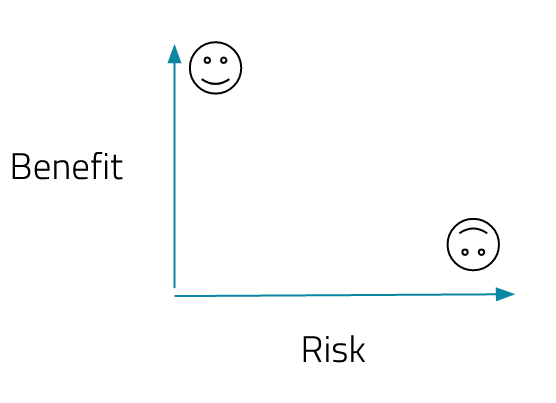
Of course, there is a balance with these issues. While it’s important to make sure that people are represented in the ways that they want to be represented in data, it is also important to avoid identifying them in data, particularly with minority groups with a smaller population. Though there isn’t a perfect solution to this question, it might help to consider this on a case by case basis and find the spot where where there is a low risk of identifying people and a high potential benefit to them as well.
This part of Day 3 is meant to set up some of the more abstract framing around these issues. Part 2 will look at potential solutions and more concrete examples. Whenever you’re ready, proceed to Day 3, Part 2 or return to the homepage.